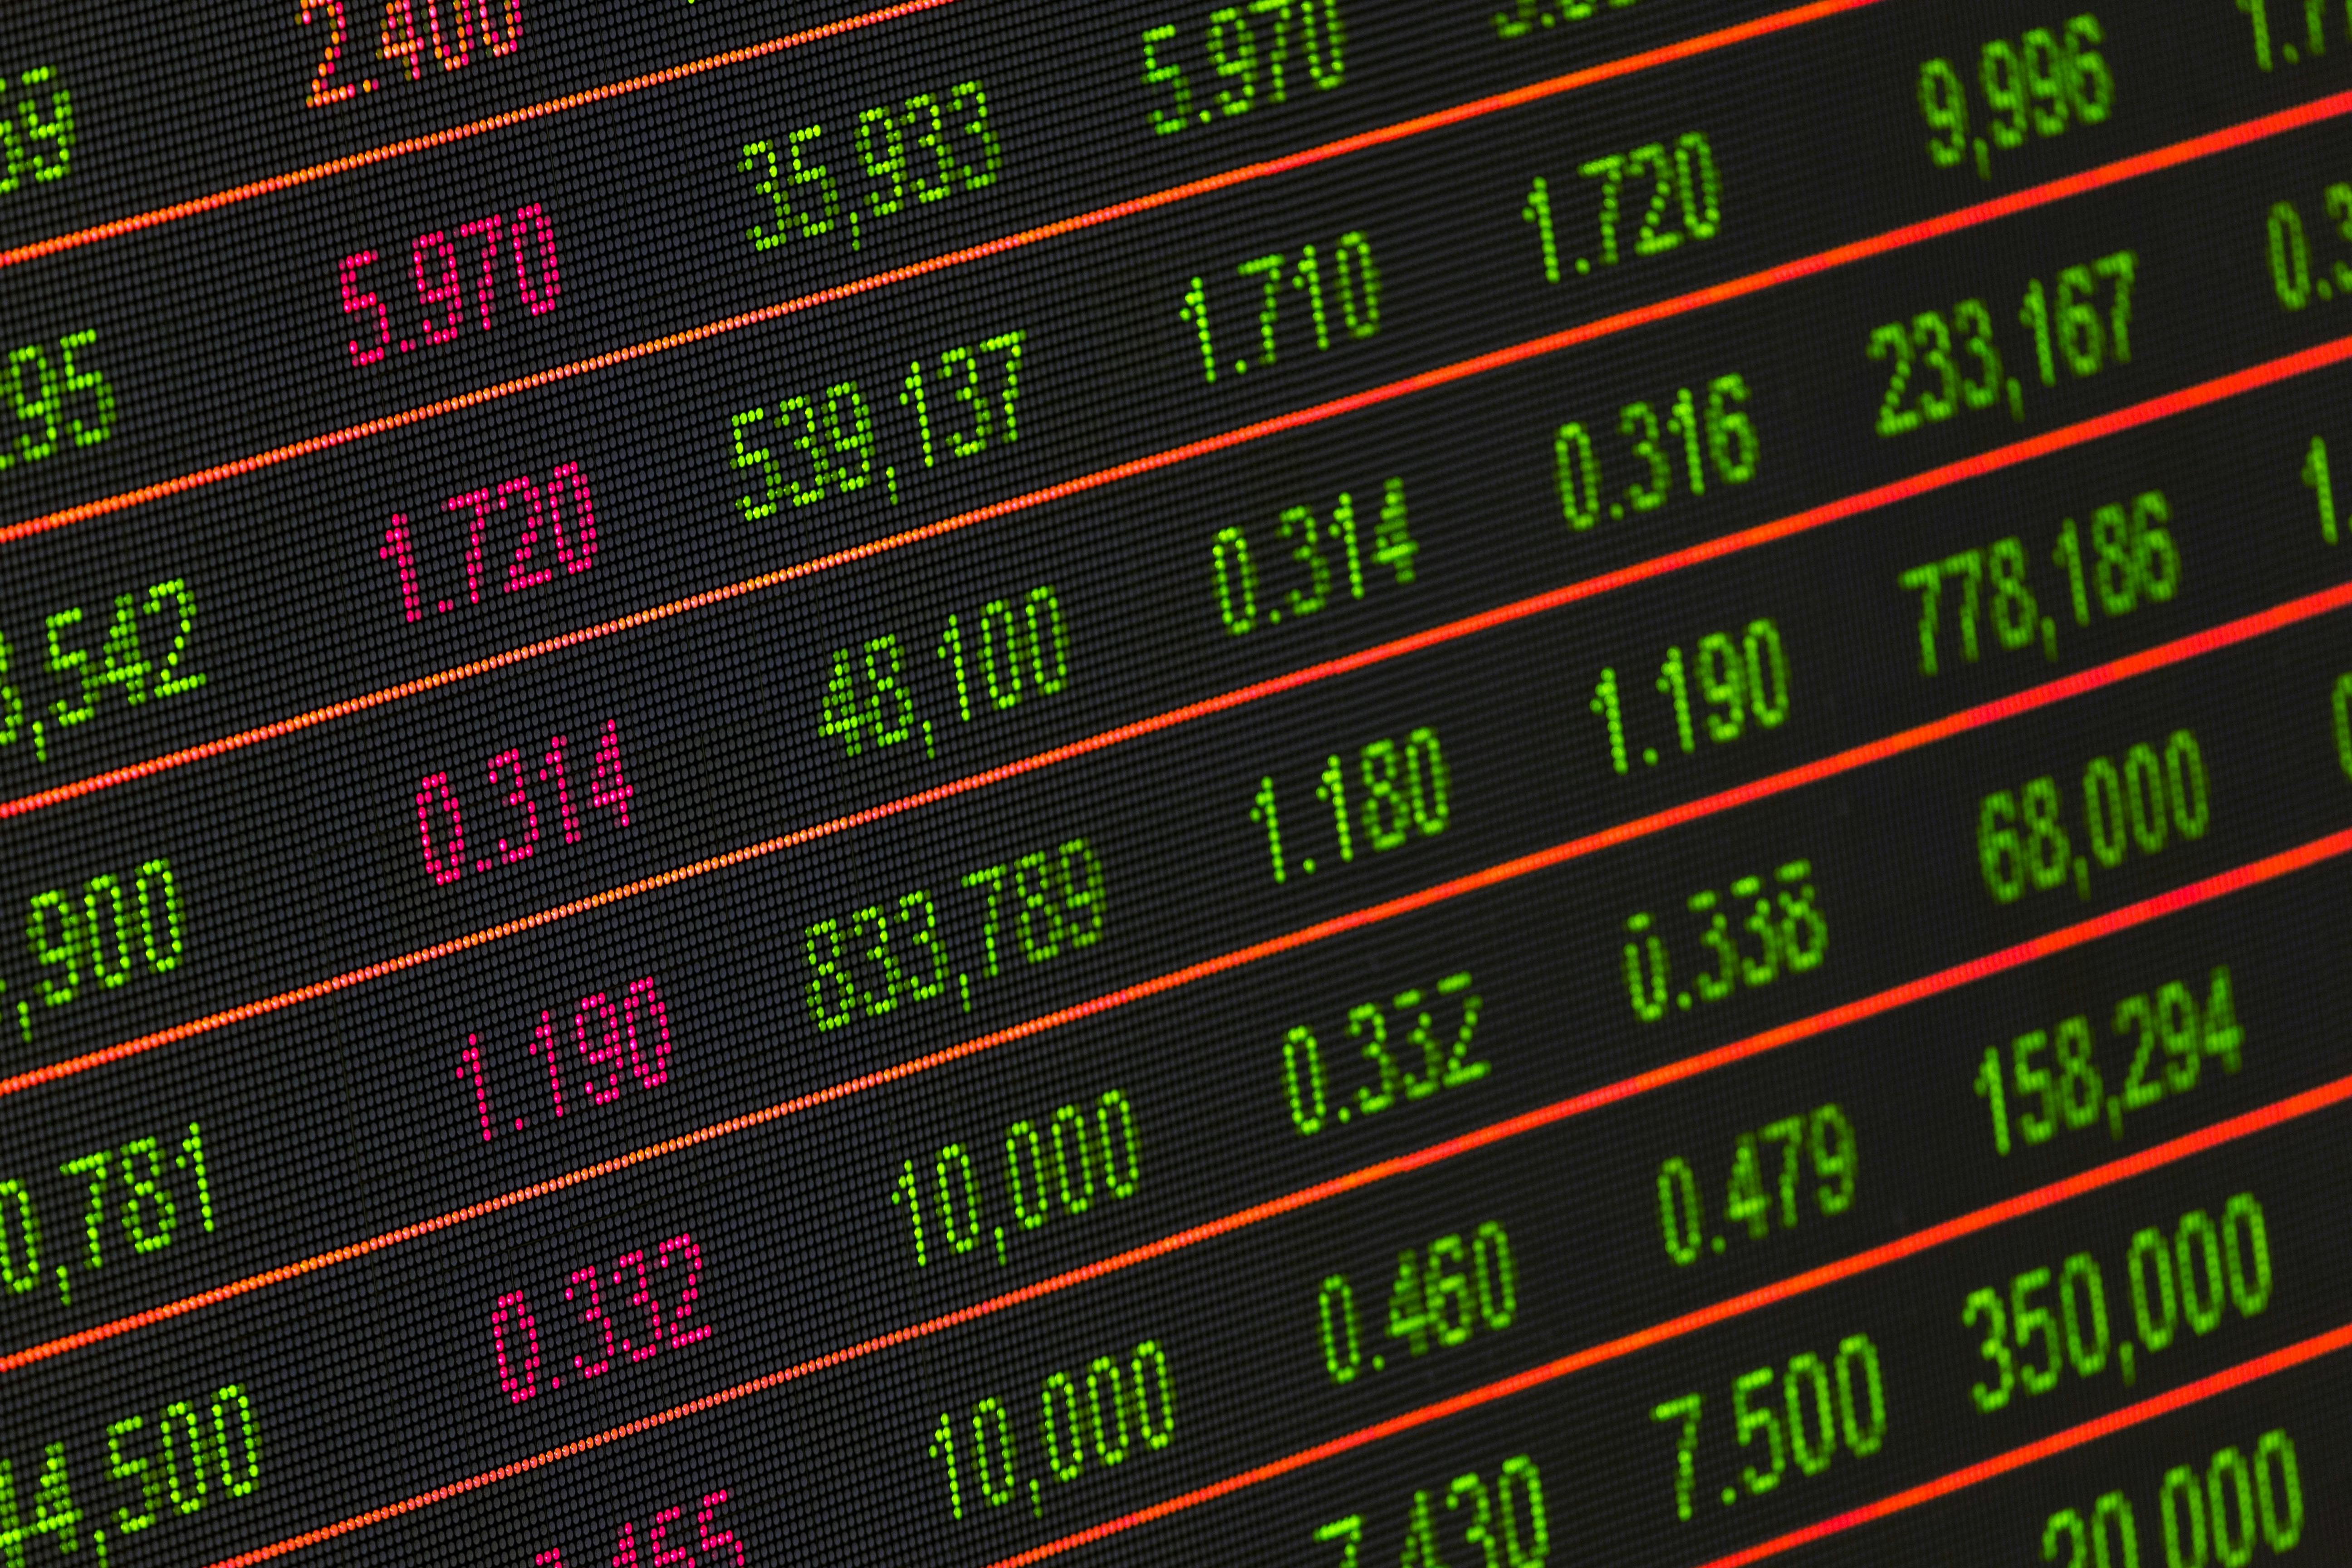
Dive into comparing professional tick data processing for indices. Explore key methods, tools, and pitfalls to build high-frequency trading strategies with precision.
Introduction
Processing high-resolution tick data for indices is a cornerstone for serious quantitative traders and fintech developers. Every microsecond of price movement, every transaction, holds critical information that can influence execution logic and define your strategy's edge. This guide focuses on comparing professional tick data processing for indices, outlining methodologies that move beyond basic spreadsheet analysis to robust, scalable solutions. We'll explore the tools and techniques required to transform raw ticks into actionable insights, ensuring your models are built on a foundation of accurate, high-fidelity data. The payoff? More reliable backtesting, reduced slippage in live trading, and the ability to detect subtle market shifts.
Prerequisites
To effectively compare and implement these methods, you'll need:
Python Proficiency: Familiarity with data manipulation libraries like Pandas, NumPy, and potentially Polars or Dask.
Understanding of Financial Data: Basic knowledge of order books, tick-by-tick data structures, and common market microstructure concepts.
Access to Tick Data: Reliable sources for historical and real-time tick data for indices. For live price feeds and historical data, consider platforms like RealMarketAPI, which provides low-latency WebSocket streams and API access.
Step 1 – Data Acquisition & Storage Architectures
The journey begins with sourcing and storing your tick data efficiently. Raw tick data for indices can easily accumulate to terabytes, making your choice of storage critical for both retrieval speed and cost.
Methods Compared:
Flat Files (CSV/Parquet/HDF5):CSV is simple but inefficient for large datasets, representing a starting point from basic spreadsheet processing. is a columnar storage format, highly efficient for analytical queries due to superior compression and read performance. is also efficient for large numerical datasets, good for structured data with metadata. For indices, Parquet is often preferred for its scalability.
Share
#tick data processing#indices trading#fintech development#data engineering#python for finance#market microstructure#realmarketapi#tick data comparison
Time-Series Databases (e.g., InfluxDB, TimescaleDB): Optimized for time-stamped data, these offer fast ingestion and querying capabilities, ideal for handling high write/read loads in real-time contexts.
import pandas as pd

# Load tick data from a Parquet file
try:
    df_ticks = pd.read_parquet('ES_tick_data.parquet') # S&P 500 E-mini futures example
    print(f"Loaded {len(df_ticks)} ticks. First 5 rows:\n{df_ticks.head()}")
except FileNotFoundError:
    print("Parquet file not found. Ensure 'ES_tick_data.parquet' exists.")
Choosing the right storage upfront prevents significant bottlenecks downstream.
Step 2 – Robust Data Cleaning and Normalization
Raw tick data is notoriously messy. It often contains erroneous entries, duplicates, out-of-sequence timestamps, and varying formats across sources. Effective cleaning is paramount for data integrity.
Methods Compared:
Timestamp Alignment: Ensure consistent timezones and handle out-of-sequence ticks, which can distort chronological analysis.
Outlier Detection & Removal: Implement statistical methods (e.g., Z-scores) to identify and filter out spurious price quotes or extreme volumes.
Duplicate Handling: Identify and remove redundant entries that arise from data feed glitches.
Standardization: Normalize trade conditions, exchange codes, and instrument identifiers, especially when consolidating data from multiple venues.
Neglecting this phase leads to garbage-in, garbage-out, invalidating any strategy built on the data. 📊
Step 3 – Feature Engineering & Bar Aggregation
Tick data itself is often too granular for direct strategy development. Transforming it into meaningful aggregates or features is a critical step in professional tick data processing for indices.
Methods Compared:
Time Bars: (e.g., 1-minute, 5-minute OHLCV) The most common aggregation. Simple, but can be misleading during low-activity periods or miss critical events during high activity.
Tick, Volume, and Dollar Bars: These aggregation methods (fixed number of ticks, fixed trade volume, or fixed dollar value) provide a more natural sampling of market activity. They can offer more consistent statistical properties than time bars, which is crucial for sophisticated models. For further insights into indicator application with aggregated data, explore resources like Mastering Williams %R on H4 Chart for Indices: A Deep Dive or learn about simpler trend-following strategies from Mastering SMA for Indices Trading: A 3-Step Developer's Guide.
Derived Features: Calculate volatility, bid-ask spreads, order book imbalances, and other custom indicators directly from the cleaned tick data to enrich your dataset for machine learning models.
This is where raw data translates into usable signals for algorithmic trading.
Step 4 – Performance Optimization and Scaling Strategies
For professional environments, especially those dealing with many indices or ultra-high-frequency strategies, optimizing processing speed and scaling infrastructure is paramount. Comparing tick data processing frameworks for large-scale operations involves more than just Python.
Methods Compared:
Vectorized Operations & Libraries: Leverage NumPy and Pandas for highly optimized, C-backed operations. For even greater speed, consider Polars, a Rust-backed DataFrame library that often outperforms Pandas on large datasets.
Parallel & Distributed Processing: Tools like Dask or Ray enable you to distribute computation across multiple CPU cores or machines, handling datasets that don't fit into memory.
Enterprise-Grade Solutions: For very large-scale, mission-critical systems, specialized databases and analytics platforms provide robust, pre-optimized solutions (beyond basic processing often found in, for example, SAP environments). Building custom low-latency systems often involves C++ for core components. Accessing API documentation for integration with such systems, like the RealMarketAPI Docs, becomes crucial.
Choosing the right approach here depends heavily on your data volume, latency requirements, and infrastructure budget.
Common Mistakes to Avoid
Ignoring Data Quality: Always validate and clean your data. Flawed data leads to flawed insights and strategies.
One-Size-Fits-All Aggregation: Relying solely on time bars can obscure significant market events. Experiment with different bar types.
Overlooking Latency: For high-frequency strategies, processing latency can severely impact your edge. Optimize for speed at every stage.
Inadequate Storage: Poor storage choices lead to slow data access, high costs, and scalability issues.
Conclusion 🚀
Comparing professional tick data processing for indices reveals that there's no single perfect solution, but rather a spectrum of methodologies tailored to specific needs. By mastering data acquisition, ensuring rigorous cleaning, intelligently engineering features, and optimizing for performance, developers and traders can build robust, high-performing algorithmic strategies. The journey from raw tick data to actionable insights is complex but incredibly rewarding, offering a significant competitive edge in the fast-paced world of indices trading. Keep iterating on your processing pipeline, leveraging new tools and techniques to stay ahead.